Graphical User Interface for GNSS-based monitoring
Graphical user interfaces for GNSS-based technology are the visible parts of programs, allowing users to operate GNSS-devices and GNSS data processing software. A lot of programs are available for GNSS-based applications with many users (e.g., GPS-based mobile navigation), but only a few for special monitoring tasks (e.g., for early warning), for which it can become necessary to develop special software packages.
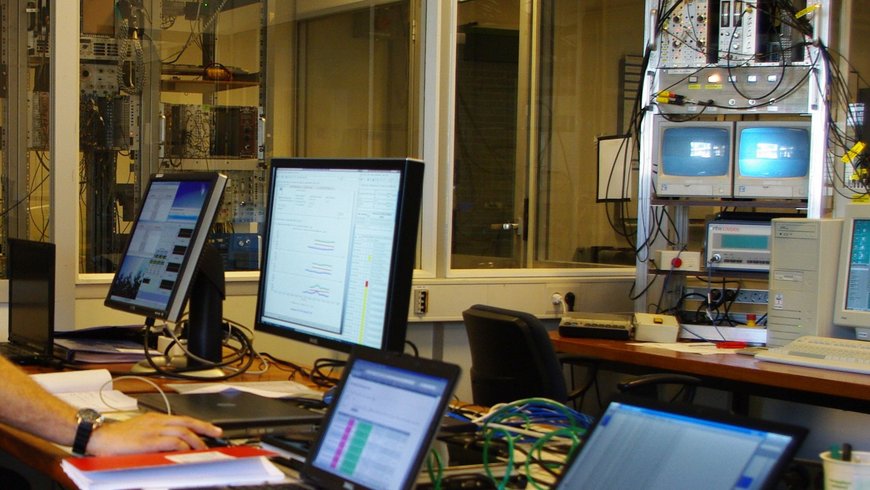
Special monitoring tasks notably need a tailored display for measured data. For early warning applications it must furthermore be demanded to have a very fast processing of relevant data and parameter, combined with directly and certainly graspable, graphical displays. A graphical user interface which fulfills these high requirements was developed for the monitoring and operation of GPS-stations (e.g., GPS real-time reference stations), the automatic near real-time GPS-processing systems and the Ground Tracking System as used in the project GITEWS. The system has a web-based design, allowing all functions and views to be provided via the Internet. A system-user does not need any special software or a certain computer operating system, a regular web-browser program is sufficient. The system displays all relevant parameter, from the operation status of an individual station or the processing system to the system products, e.g., as co-seismic station displacements, derived from the measurements. Beyond that the system offers comfortable functions for otherwise laborious administrative tasks, like the integration of new GNSS-sensors. If necessary the system design also allows an adaptation to new tasks. Examples are the proven interaction with real-time GNSS-data processing software and an experiment to determine the radiation resistance (for space qualification) of a GNSS-receiver at a Cyclotron radiation source (see picture below).


