

Summary
The world's strongest earthquakes occur at subduction zones. There, one tectonic plate slides under another, repeatedly catching and releasing along the ‘megathrust’ fault that separates them. When the tension is released in a jolt, earthquakes occur. It has long been observed that the tectonic processes between major earthquakes also leave lasting marks on the landscape above. Now an international research team led by Bar Oryan, now at UC San Diego, with the participation of Luca Malatesta from the GFZ German Research Centre for Geosciences, has for the first time identified a mechanism for this and published it in the journal Science Advances. According to the study, in the period between major quakes, thousands of small earthquakes above the megathrust lift a narrow strip of land. They are distributed according to the size of the “sticky” part of the megathrust, where tension builds up. The land uplift can therefore be used to draw conclusions about the likely location, size, and hazard potential of future major earthquakes. This is particularly useful in areas where earthquakes and landscape deformations cannot be observed directly. And it helps to understand the mechanisms of major earthquakes.
The mechanism of strong earthquakes and tsunamis at subduction zones
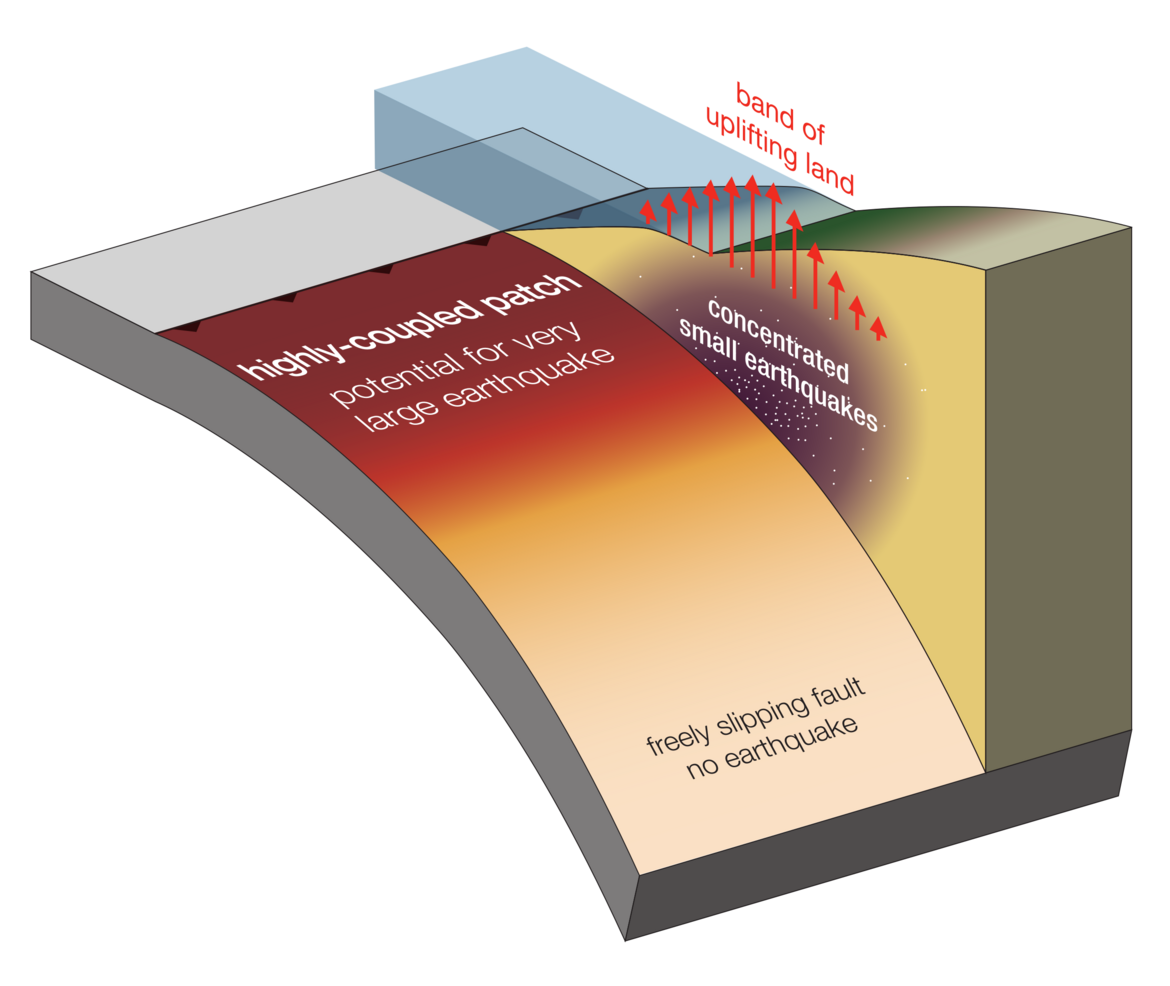
The largest earthquakes of the planet are created along subduction zones at the margin of oceans, where one tectonic plate slides beneath another. The contact surface between the plates is known as the ‘megathrust’. It is not smooth and slippery, so sliding is not frictionless. Instead, the plates get stuck against each other due to their rough surfaces. If the friction between the two plates is high, this is referred to as ‘high coupling’. The upper plate then bends like an elastic springboard with the down-going plate until it cannot bend any further and springs back. This causes the contact surface to slip suddenly and release energy: this is the earthquake.
At a subduction zone, slip on the contact patch can reach tens of metres over a length of hundreds of kilometres. If there is ocean above it, it can suddenly displace a huge volume of seawater as it springs back, triggering a destructive tsunami that can cross entire oceans wreaking destruction even thousands of kilometres away.
Motivation: Determining the highly coupled contact area of tectonic plates
The larger the highly coupled contact area in a subduction zone, the more seismic energy can be released during an earthquake. It is therefore crucial to determine the size of the “highly coupled” contact patch as accurately as possible in order to estimate the potential earthquake hazard and prepare accordingly, for example by adapting the building code or developing emergency response strategies.
However, determining the highly coupled contact patch of tectonic plates has been a challenge, as direct observations of these patches are hard to come by. Researchers usually use one of two methods to do this: Either they measure deformation when a quake occurs, or the slow movement of the land in the build-up to a future earthquake. However, both methods only provide a snapshot in time of the earthquake system.
The role of landscape form
“In contrast, landscapes record the combined effects of tectonic and surface processes, such as earthquakes and river erosion, over hundreds of thousands of years through their shape,” explains Dr Luca Malatesta, working group leader in GFZ Section 4.7 “Earth Surface Process Modelling”.
Previous studies identified a promising correlation between the extent of the strongly coupled contact patch and features of the subduction landscape above, such as the edge of the shallow water continental shelf along the coastlines of subduction zones. Until now, however, a mechanism to explain these observations remained elusive.
New approach: computer simulation of millions of small earthquakes
Now a research team led by Dr Bar Oryan, formerly ENS Paris, now UC San Diego (USA), with the collaboration of Dr Jean-Arthur Olive, ENS Paris, Prof. Dr Romain Jolivet, ENS Paris — and currently Humboldt guest scientist at the GFZ — and GFZ researcher Dr Luca Malatesta, has uncovered such a mechanism for the first time.
Using a computer model, they simulated millions of small, barely perceptible earthquakes that happen between the very large subduction earthquakes. These small quakes concentrate above the edge of the highly coupled patch, where the stress changes are greatest.
“Each small earthquake, though imperceptible on its own, gradually shifts the landscape. Over centuries, these tiny shifts accumulate and raise a band of land that marks the edge of the highly coupled patch,” explains Luca Malatesta.
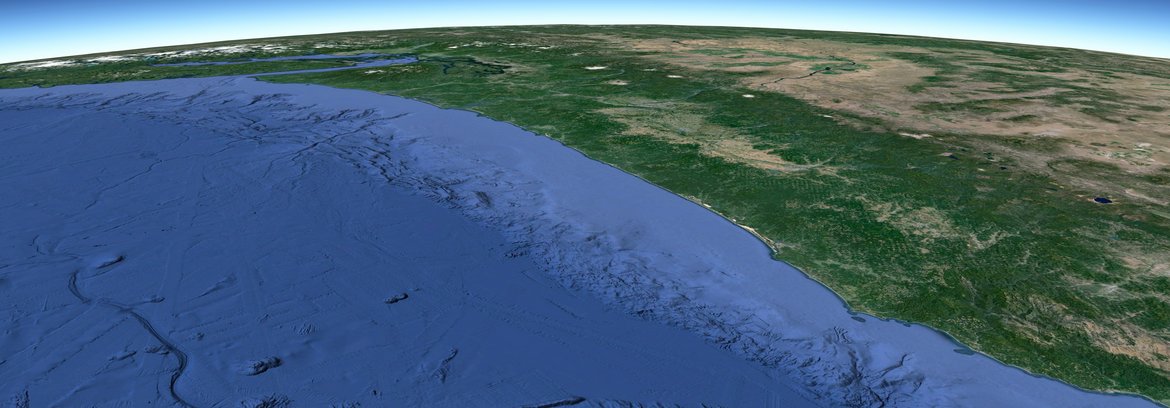
The researchers have calculated their model for three different subduction zones in the world: in the Cascadia region, which covers the central Pacific coast of the North American continent (British Columbia (Canada), Washington, Oregon (USA); on the Pacific coast of Chile and in the Himalayas.
Example Cascadia subduction zone North America
For the Cascadia subduction zone, for example, they simulated 1.9 million synthetic earthquakes across a two-dimensional cross-section. The dimension and distribution of the earthquakes were derived from seismic catalogues of past events and according to the known geology of the site. Based on current seismicity rates in the region, the researchers estimate that this covers a development of around 72,000 years or 140 earthquake cycles.
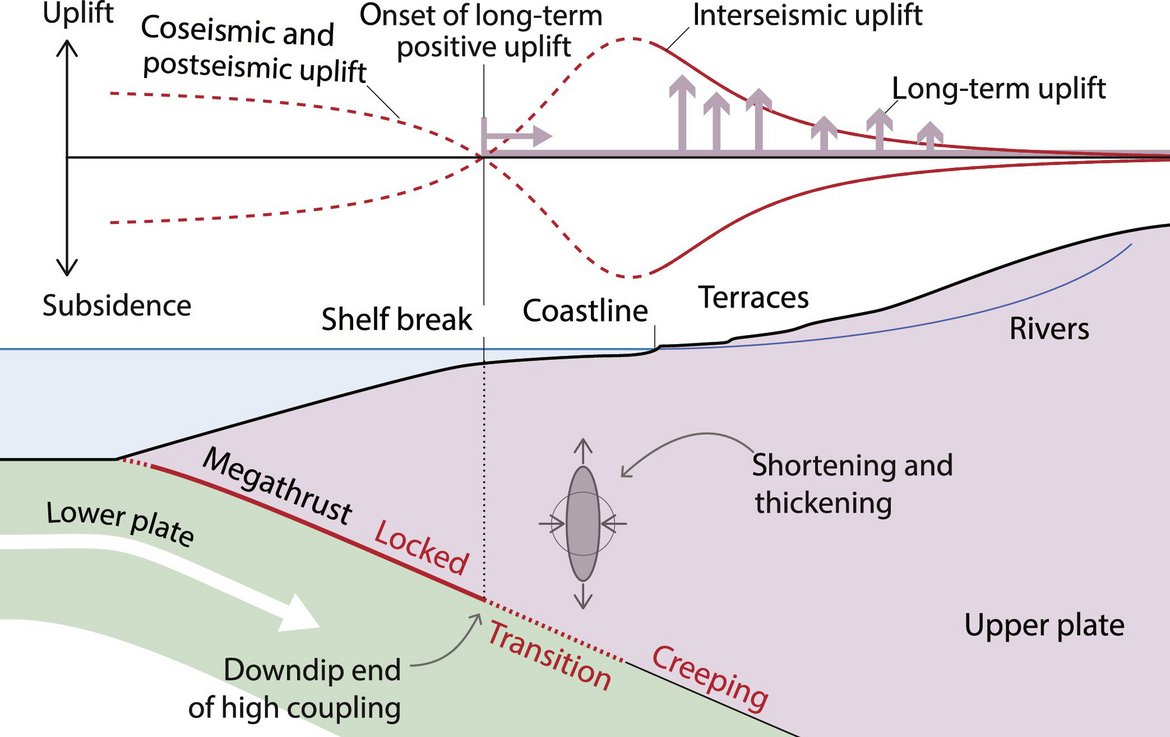
“This results in a long-term deformation pattern like a hinge line between seaward subsidence and landward uplift of the Earth's surface. It corresponds to the edge of the Cascadia shelf and the downdip end of the fully locked zone, which supports previous interpretations,” explains Malatesta. “In addition, the uplift rates we determined are of a magnitude that matches the marine terraces. We therefore believe that the mechanism we used is useful for describing the long-term development of the region”.
The researchers also found good agreement between their model and the real conditions for the other regions.
Resume
“The mechanism we found explains the correlation between the uplifted areas and the strongly coupled areas of the megathrust. It enables us to reproduce developments in megathrust coupling in the world's subduction zones over geological time. In regions that have experienced a major earthquake, we can now better understand whether the underlying rupture was typical or unusual given the landscape record above. In addition, this will allow us to gain new insights into future seismic hazard, especially in regions that are not covered by geodetic or seismic monitoring networks,” resumes Malatesta.
Original publication:
Bar Oryan et al., Megathrust locking encoded in subduction landscapes. Sci. Adv. 10, eadl4286(2024). DOI:10.1126/sciadv.adl4286
https://www.science.org/doi/10.1126/sciadv.adl4286
Background: Subduction landscape research at the GFZ.
This new study is the capstone of a whole series of papers in which, over the years, GFZ scientists have provided crucial evidence linking seismic patches and the landscape above:
Luca Malatesta and colleagues (Section 4.7 “Earth Surface Process Modelling”) found that the edge of continental shelves could be used as a guide to find the deeper end of the coupled patch.
Publication: Malatesta, L. C., Bruhat, L., Finnegan, N. J., & Olive, J. L. (2021). Co-location of the downdip end of seismic coupling and the continental shelf break. Journal of Geophysical Research: Solid Earth, 126, e2020JB019589. https://doi.org/10.1029/2020JB019589
Vassiliki Mouslopoulou, Onno Oncken (Section 4.1 “Litoshpere Dynamics”), Sebastian Hainzl (Section 2.1 “Physics of Earthquakes and Volcanoes”) and colleagues showed that groups of earthquakes above subductions could create patterns of localized uplift.
Publication: Mouslopoulou, V., O. Oncken, S. Hainzl, and A. Nicol (2016), Uplift rate transients at subduction margins due to earthquake clustering, Tectonics, 35, 2370–2384, doi:10.1002/2016TC004248
And finally, Mathias Rosenau, Jo Lohrmann, and Onno Oncken (Section 4.1 “Litoshpere Dynamics”) used a scaled physical model of an entire subduction to show that repeated large earthquakes leave a permanent landscape signature.
Publication: Rosenau, M., J. Lohrmann, and O. Oncken (2009), Shocks in a box: An analogue model of subduction earthquake cycles with application to seismotectonic forearc evolution, J. Geophys. Res., 114, B01409, doi:10.1029/2008JB005665.
Romain Jolivet from ENS Paris, currently hosted in Section 4.1 “Litoshpere Dynamics” at GFZ under a Bessel award of the Humboldt Foundation, showed that long-term deformation above the Chilean subduction was reflected in satellite-based measures of deformation between large earthquakes.
Publication: Jolivet R., Simons, M., Duputel, Z., Olive, J.-A., Bhat, H. S., & Bletery, Q. (2020). Interseismic loading of subduction megathrust drives long-term uplift in Northern Chile. Geophysical Research Letters, 47, e2019GL085377. https://doi.org/10.1029/2019GL085377


![[Translate to English:] Abror Gafurov von dem Schriftzug "Welcome to Azerbaijan" und den UN und COP Logos](/fileadmin/_processed_/2/5/csm_2024_11_Baku_COP29_Abror_Gafurov_26a3f3a1b5.webp "[Translate to English:]")


![[Translate to English:] Gruppenbild mit 4 Personen](/fileadmin/_processed_/8/d/csm_20241017_GFZ-Emmerman-Medal-005_web_reinhardtundsommer_db407e5dc8.webp)


