

Finalising Surveys for the Baltic Motorways of the Sea (FAMOS)
GFZ/Section 1.2 was cooperation partner of the EU project FAMOS (Finalising Surveys for the Baltic Motorways of the Sea). Among others, FAMOS included all aspects of hydrographic surveying in the Baltic Sea according to the recommendations of the Baltic Sea Hydrographic Commission (HSHC) and the Baltic Marine Environment Protection Commission (Helsinki Commission – HELCOM).
FAMOS was a joint project of hydrographic, maritime and geodetic institutions and agencies of almost all EU countries around the Baltic Sea. FAMOS was co-funded by the European Commission within the Connecting Europe Facility (CEF Transport). FAMOS aimeds to improve the safety on the motorways of the sea in the Baltics. Part of the FAMOS activities was estimation of a new gravimetric geoid as common and unified chart datum in this sea.
- Project management: Swedish Maritime Administration (Sjöfartsverket)
- Geodetic project partners:
- Deutsches GeoForschungsZentrum GFZ, Bundesamt für Seeschiffahrt und Hydrographie, Federal Agency for Cartography and Geodesy (BKG)
- Technical University of Denmark (DTU Space)
- Lantmäteriet (Schweden)
- National Land Survey of Finnland (NLS)
The FAMOS project started in 2014 und was finalized by 2019. The geoid determination in the FAMOS project was co-funded by the EU Commission with 50% of the costs. The calculation of the new gravimetric geoid (the Baltic Sea Chart Datum 2000) is currently being completed under the direction of the HSHS Chart Datum Working Group.
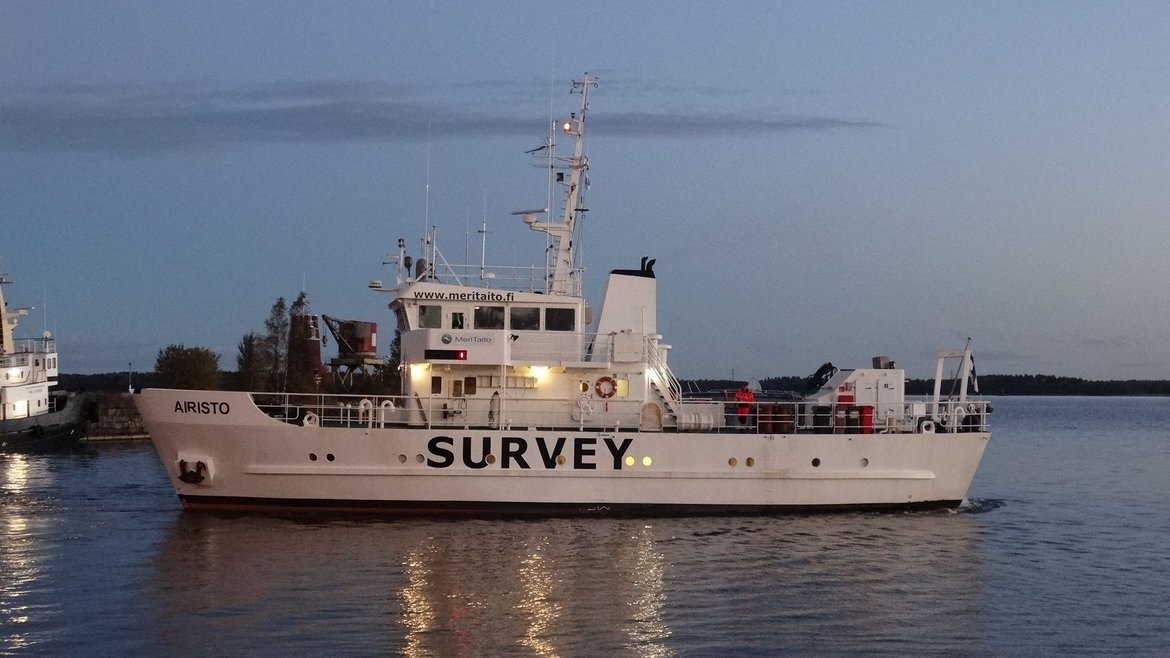
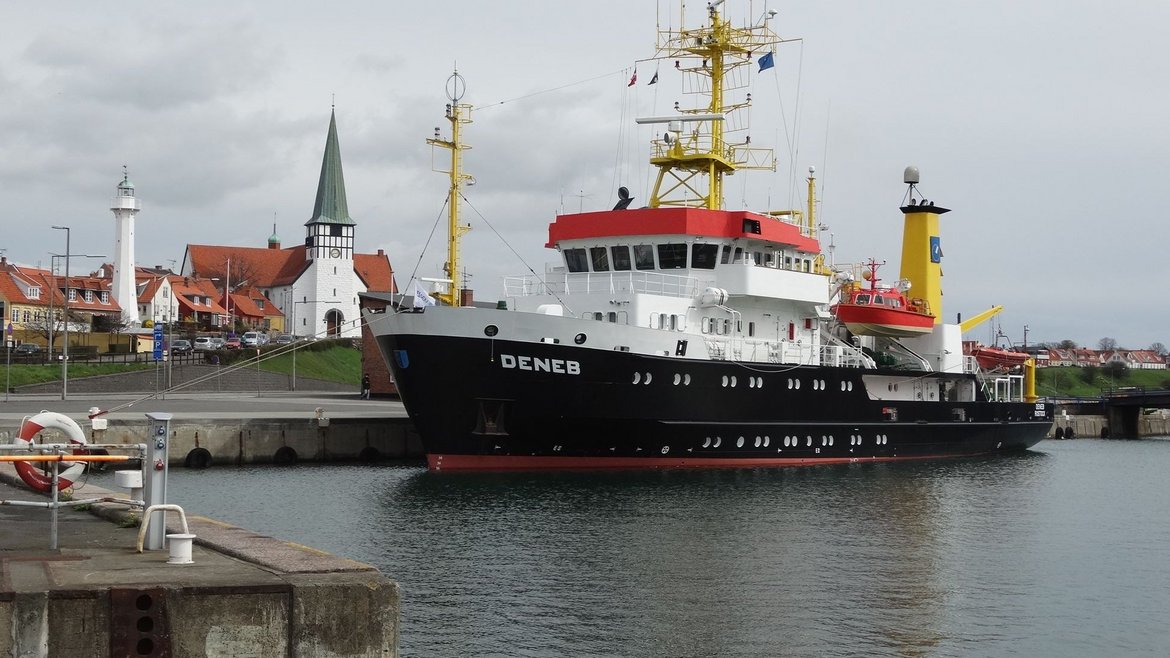
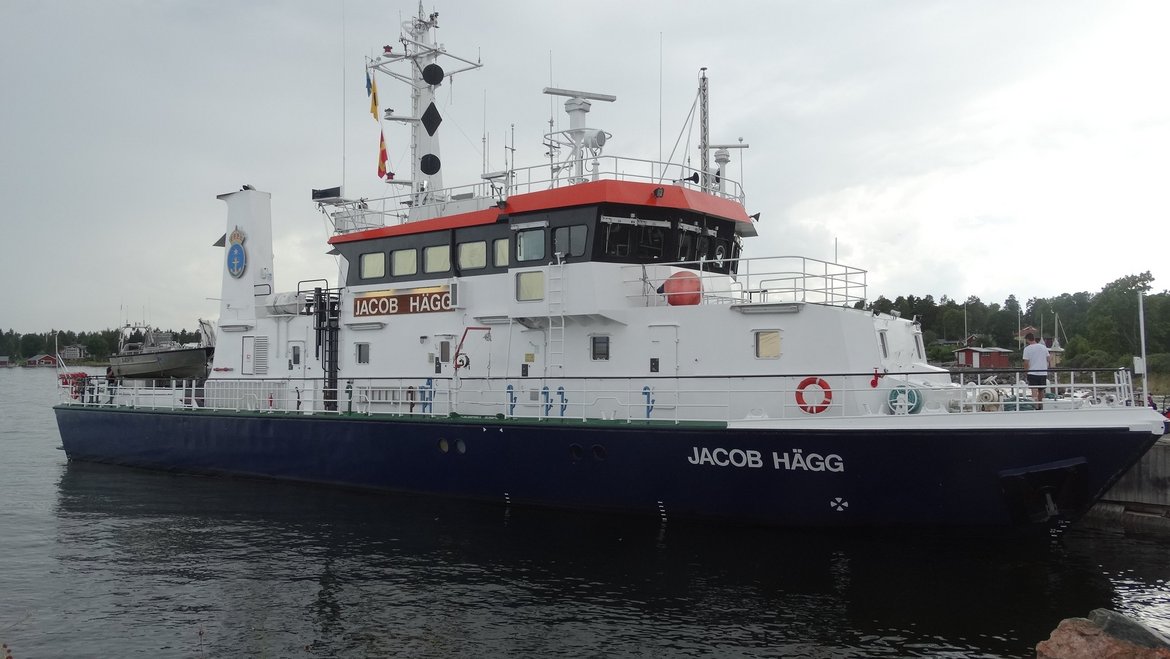
GFZ’s contribution in the FAMOS project was conduction of shipborne gravimetry campaigns including the related data processing. The shipborne gravity measurements for FAMOS were done with the Chekan-AM gravimeter equipment.

